ATS Robot
Lab: testing whether a trading strategy really makes money
Our own research, not a service we sell. A tool that measures honestly, on historical data, whether a trading strategy makes money. So far it has mostly shown that ours doesn't.
In numbers
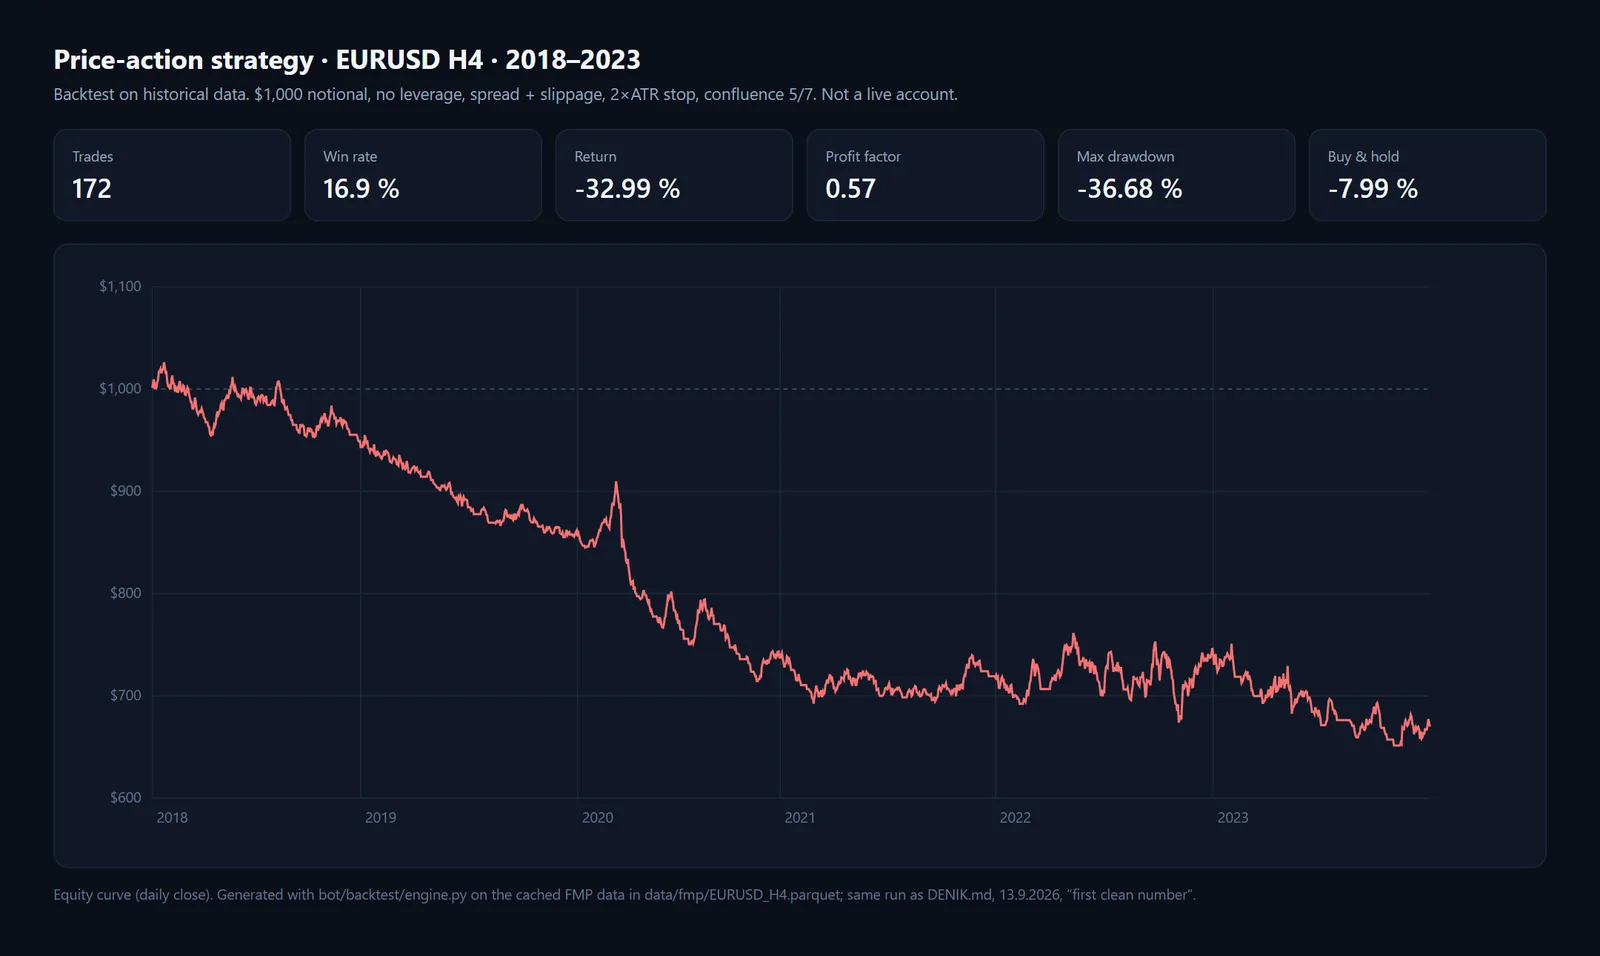
- trades in the EURUSD 2018–2023 historical test, a losing result
- 172
- Source: Research log, entry of 13 Sep 2026
Challenge
Building a bot that sends orders to a broker is the easy part. Building one that makes money over time is a different problem. A test on historical data can also show convincing profits that really came from bad data or from tuning to a single market.
This is internal research, not a service we offer. We wanted to know whether a simple technical strategy has a measurable edge, and to have tools that can tell reliably.
Solution
The bot is split into parts: data sources, strategies, historical testing and, later, a broker connection. Strategies can be tested without a broker. One uses indicators. The other reads the price itself using seven factors, including the price bands where moves tend to stall.
The test never looks ahead: it takes signals from a closed candle and opens the trade on the next one. It charges fees and price slippage and uses a stop-loss. It doesn't hold positions across gaps in the data, and a stop-loss jumped by a price gap fills at the price it would really have filled at.
Every step goes into a research log. A separate reviewer judges each result and may never suggest changes. Data from 2024 onwards is locked away as a control sample.
How it works
- 1
Data
Historical prices are downloaded in chunks and stored. A check reports any gaps.
- 2
Strategy
A strategy receives a stretch of history and returns a signal with its reasons. Both strategies run on identical data.
- 3
Historical test
The bot walks through history with fees and stop-losses, and returns the trades, how the account developed, and results compared with simply holding the market.
- 4
Review
Each result goes into the log and to the reviewer. A practice account comes into play only once a strategy holds up.
What it does
- Testing that never looks ahead, with fees, slippage and a stop-loss
- Protection against data gaps and realistic fills for stop-losses jumped by a gap
- Two comparable strategies: indicators, and price reading with seven factors
- Stored price history with a check that it arrived complete
- Testing on several markets, so tuning to a single market shows up
- Research log and a locked control sample
Outcome
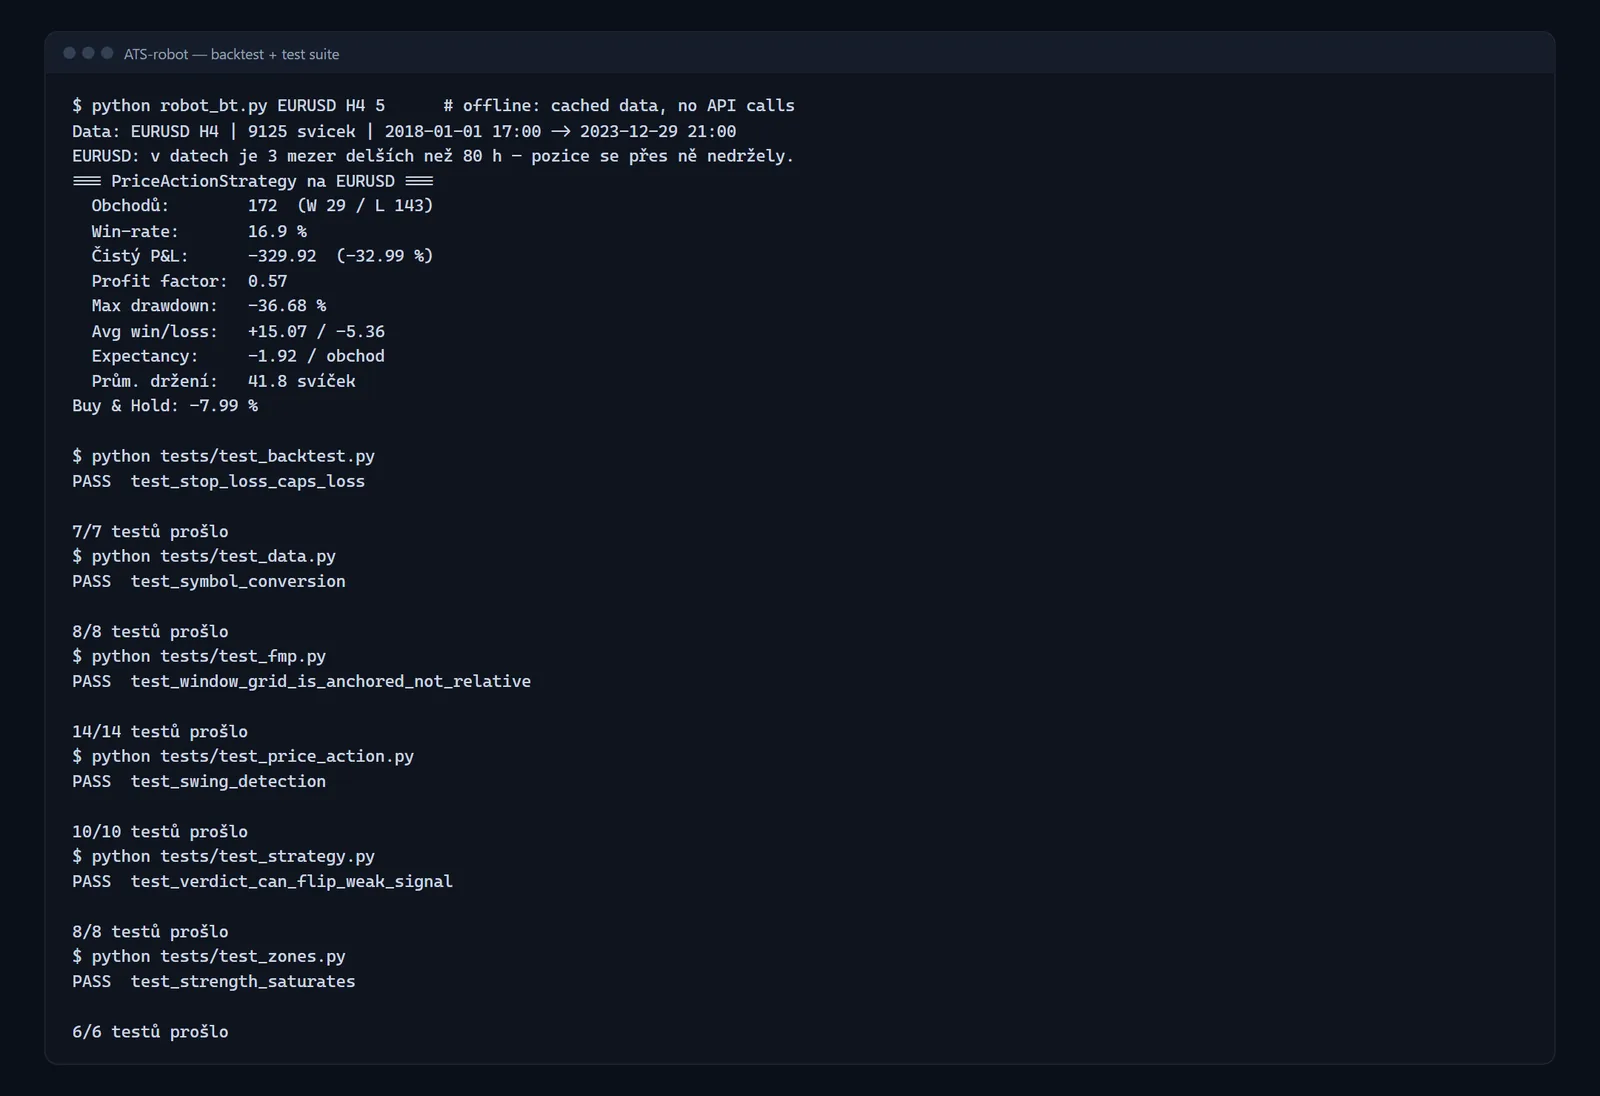
The bot does not trade yet, not even on a practice account. The main finding is negative and well supported: on EURUSD (four-hour chart, 2018–2023), the price-reading strategy loses money in the historical test, over 172 trades.
It didn't hold up on other markets either: five of the six markets checked ended in a loss. That's why we don't let it near real money.
Every number here comes from tests on historical data, not from live trading, and none of it is a promise of returns.
Contact